Monitoring is an essential part of DevOps. Every site you deploy, every app you deploy has to be continuously monitored since you never know when an error might arise. An error, even a small one can cause a catastrophic failure and cause the site or app to go down instantly.
Here comes the role of monitoring. Monitoring allows us to continuously track the state of the site or app and swiftly take action in case the infrastructure goes down.
Fortunately, a lot of monitoring tools are available in the market. One of these tools is Prometheus. It is a great open-source tool for real-time monitoring and alerting. It records real-time metrics in a time series database built using an HTTP pull model. These metrics tell us the current state of the site or app etc., in real-time.
However, keeping a track of these metrics is not very convenient due to their form. An average person always prefers an interactive and graphical representation over textual. Here the role of Grafana comes into play. It is multi-platform open-source analytics and interactive visualization web application. It provides charts, graphs, and alerts for the web when connected to supported data sources. When grafana is configured with Prometheus as the data source, it can represent the metrics is an interactive GUI with graphs, charts, etc.
Pre-requisites:
- Minikube installed and running
- kubectl configured and added to the path
- A data source which is constantly exporting the metrics( For this task I am using a node exporter that is constantly exporting the metrics of a Linux VM at port number 9100 )
Manifest file
To deploy the setup I am going to use 2 main Kubernetes manifest file
Manifest file for Prometheus
|
apiVersion: v1
kind: Service
metadata:
name: prometheus
labels:
app: prometheus
spec:
ports:
- port: 9090
nodePort: 30000
selector:
app: prometheus
tier: backend
type: NodePort
---
apiVersion: v1
kind: PersistentVolumeClaim
metadata:
name: prometheus-pv-claim
labels:
app: prometheus
spec:
accessModes:
- ReadWriteOnce
resources:
requests:
storage: 20Gi
---
apiVersion: v1
kind: ConfigMap
metadata:
name: prometheus-config
labels:
name: prometheus-config
data:
prometheus.yml: |-
global:
scrape_interval: 5s
evaluation_interval: 5s
alerting:
alertmanagers:
- static_configs:
- targets:
#rule_files:
# - "first_rules.yml"
# - "second_rules.yml"scrape_configs:
- job_name: 'prometheus'
#metrics default path is /metrics
static_configs:
- targets: ['localhost:9090']- job_name: 'node1'
static_configs:
- targets: ['192.168.99.101:9100']
---
apiVersion: apps/v1 # for versions before 1.9.0 use apps/v1beta2
kind: Deployment
metadata:
name: prometheus
labels:
app: prometheus
tier: backend
spec:
selector:
matchLabels:
app: prometheus
tier: backend
strategy:
type: Recreate
template:
metadata:
labels:
app: prometheus
tier: backend
spec:
containers:
- image: prom/prometheus:latest
name: prometheus
args:
- "--config.file=/etc/prometheus/prometheus.yml"
ports:
- containerPort: 9090
name: prometheus
volumeMounts:
- name: prometheus-persistent-storage
mountPath: /prometheus
- name: prometheus-config
mountPath: /etc/prometheus/
volumes:
- name: prometheus-persistent-storage
persistentVolumeClaim:
claimName: prometheus-pv-claim
- name: prometheus-config
configMap:
name: prometheus-config
|
This file will deploy, configure and expose Prometheus at port 30000
Manifest file for Grafana
|
apiVersion: v1
kind: Service
metadata:
name: grafana
labels:
app: grafana
spec:
ports:
- port: 3000
nodePort: 30001
selector:
app: grafana
tier: frontend
type: NodePort
---
apiVersion: v1
kind: PersistentVolumeClaim
metadata:
name: grafana-pv-claim
labels:
app: grafana
spec:
accessModes:
- ReadWriteOnce
resources:
requests:
storage: 20Gi
---
apiVersion: apps/v1 # for versions before 1.9.0 use apps/v1beta2
kind: Deployment
metadata:
name: grafana
labels:
app: grafana
tier: frontend
spec:
selector:
matchLabels:
app: grafana
tier: frontend
strategy:
type: Recreate
template:
metadata:
labels:
app: grafana
tier: frontend
spec:
containers:
- image: grafana/grafana:latest
name: grafana
ports:
- containerPort: 3000
name: grafana
volumeMounts:
- name: grafana-persistent-storage
mountPath: /var/lib/grafana
volumes:
- name: grafana-persistent-storage
persistentVolumeClaim:
claimName: grafana-pv-claim
|
This file will deploy, configure and expose Grafana at port 30001
Process:
We will first create the Service for prometheus. This service will expose prometheus at port no. 30000. Due to this we are able to access the prometheus WebUI at http://<minikube ip>:30000
|
apiVersion: v1
kind: Service
metadata:
name: prometheus
labels:
app: prometheus
spec:
ports:
- port: 9090
nodePort: 30000
selector:
app: prometheus
tier: backend
type: NodePort
|
Creating a persistent volume claim. This claim allows us to create a volume that will store some data. In this case, we will configure it to store the metrics and allot it 20 GiB of space.
|
apiVersion: v1
kind: PersistentVolumeClaim
metadata:
name: prometheus-pv-claim
labels:
app: prometheus
spec:
accessModes:
- ReadWriteOnce
resources:
requests:
storage: 20Gi
|
Creating the config file for Prometheus. This is very important as in this file we configure Prometheus to import the metrics from node exporter
|
apiVersion: v1
kind: ConfigMap
metadata:
name: prometheus-config
labels:
name: prometheus-config
data:
prometheus.yml: |-
global:
scrape_interval: 5s
evaluation_interval: 5s
alerting:
alertmanagers:
- static_configs:
- targets:
#rule_files:
# - "first_rules.yml"
# - "second_rules.yml"scrape_configs:
- job_name: 'prometheus'
#metrics default path is /metrics
static_configs:
- targets: ['localhost:9090']- job_name: 'node1'
static_configs:
- targets: ['192.168.99.101:9100']
|
Now we have to create the deployment for Prometheus. It will pull the Prometheus image from the docker hub, configure it, then create and mount the persistent volume at the destination folder. Prometheus usually stores the metrics at a folder called /metrics, so we mount the volume to this /metrics folder.
|
apiVersion: apps/v1 # for versions before 1.9.0 use apps/v1beta2
kind: Deployment
metadata:
name: prometheus
labels:
app: prometheus
tier: backend
spec:
selector:
matchLabels:
app: prometheus
tier: backend
strategy:
type: Recreate
template:
metadata:
labels:
app: prometheus
tier: backend
spec:
containers:
- image: prom/prometheus:latest
name: prometheus
args:
- "--config.file=/etc/prometheus/prometheus.yml"
ports:
- containerPort: 9090
name: prometheus
volumeMounts:
- name: prometheus-persistent-storage
mountPath: /prometheus
- name: prometheus-config
mountPath: /etc/prometheus/
volumes:
- name: prometheus-persistent-storage
persistentVolumeClaim:
claimName: prometheus-pv-claim
- name: prometheus-config
configMap:
name: prometheus-config
|
This deployment also mounts the Prometheus config file to the folder /etc/prometheus using a separate volume.
Now that manifest file for Prometheus is created we shall start with the one for Grafana. Similarly like Prometheus, we have to create a Service that exposes Grafana at a specified port( 30001 here )
|
apiVersion: v1
kind: Service
metadata:
name: grafana
labels:
app: grafana
spec:
ports:
- port: 3000
nodePort: 30001
selector:
app: grafana
tier: frontend
type: NodePort
|
We shall attach persistent storage for grafana also. For this, we need the persistent volume claim.
|
apiVersion: v1
kind: PersistentVolumeClaim
metadata:
name: grafana-pv-claim
labels:
app: grafana
spec:
accessModes:
- ReadWriteOnce
resources:
requests:
storage: 20Gi
|
Now we can create the deployment. This deployment will pull the grafana image from the docker hub, create the volume, and configure the container. We mount the volume at /var/lib/grafana
|
apiVersion: apps/v1 # for versions before 1.9.0 use apps/v1beta2
kind: Deployment
metadata:
name: grafana
labels:
app: grafana
tier: frontend
spec:
selector:
matchLabels:
app: grafana
tier: frontend
strategy:
type: Recreate
template:
metadata:
labels:
app: grafana
tier: frontend
spec:
containers:
- image: grafana/grafana:latest
name: grafana
ports:
- containerPort: 3000
name: grafana
volumeMounts:
- name: grafana-persistent-storage
mountPath: /var/lib/grafana
volumes:
- name: grafana-persistent-storage
persistentVolumeClaim:
claimName: grafana-pv-claim
|
So, now both the manifest files are ready and we can now deploy them. But, we shall create another file called kustomization.yaml. What this file does is bind the two resources (prometheus.yaml and grafana.yaml)
|
apiVersion: kustomize.config.k8s.io/v1beta1
kind: Kustomization
resources:
- prometheus.yaml
- grafana.yaml
|
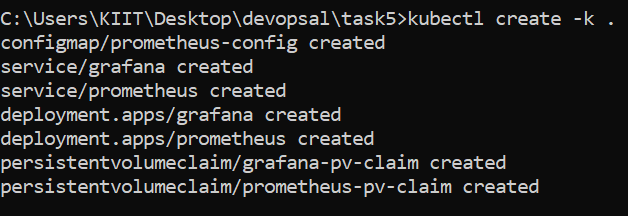
Now we can deploy the whole setup using a single line of code. Using cmd head to the directory that houses the code and executes this
kubectl create -k .
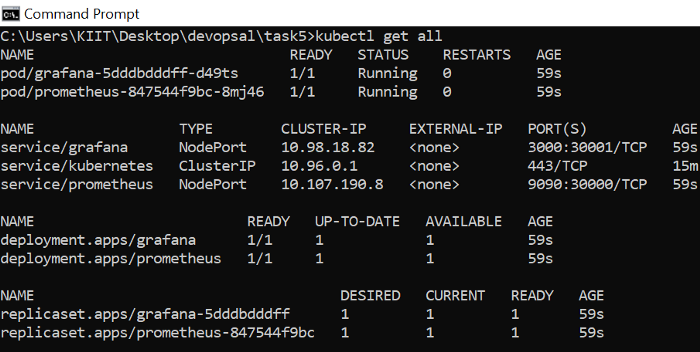
Now you can see the whole setup is created and the pods are running
Head to the site http://<minikube ip>:30000 and you will see prometheus is deployed. You need to know a thing or two PromQL to navigate through prometheus TSDB
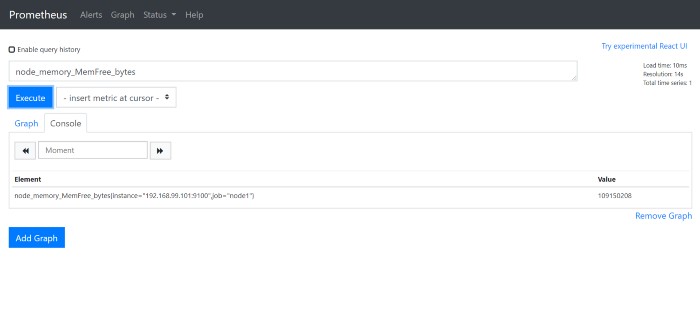
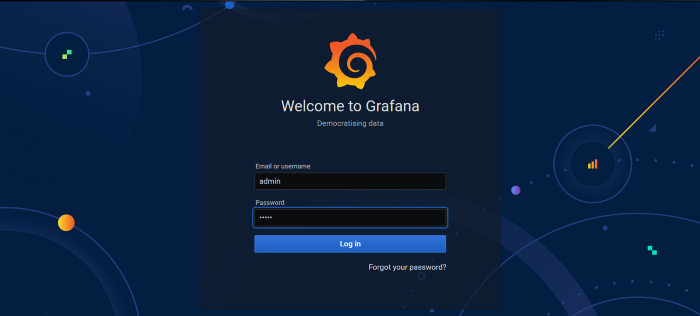
This query shows the no.of free bytes in the Linux VM memory where node exporter is running at the moment. This number keeps changing with time. To see the variation over time we now go to Grafana to see the graph. Go to http://<minikube ip>:30001 and you can see the Grafana login page. By default, the grafana login id and password are set to “admin”
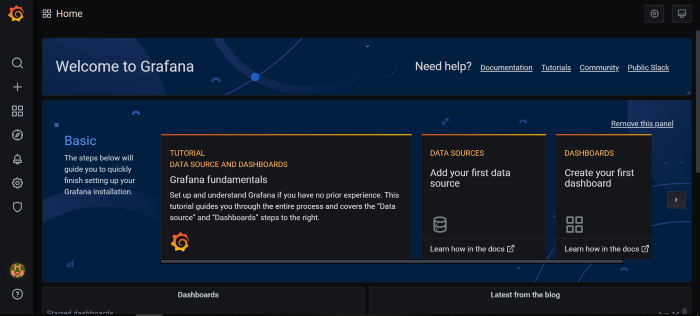
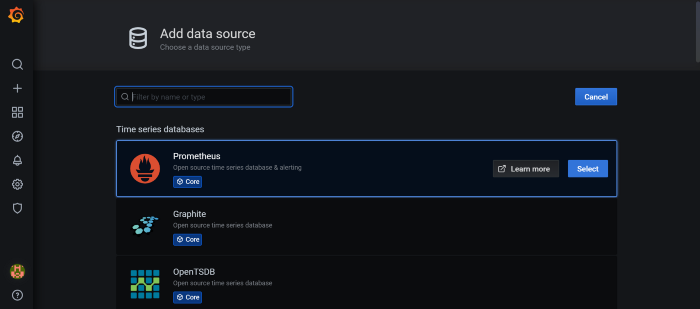
From the grafana welcome screen select “Add data source”. There is a wide range of available options but, we shall choose Prometheus
This is the dashboard
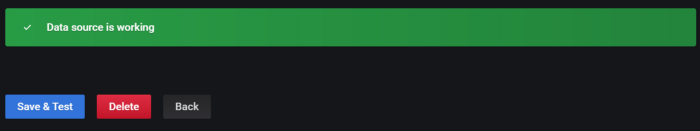
In the URL section add the URL of Prometheus website
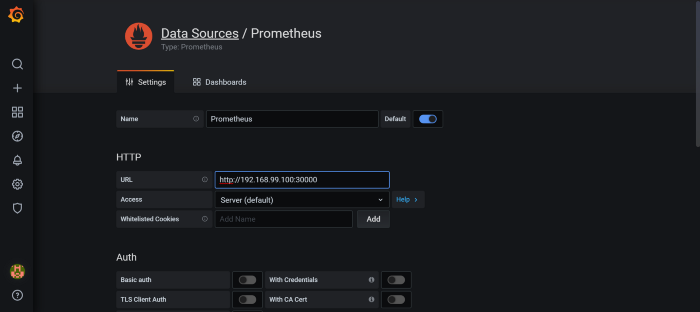
select “Save and Test”
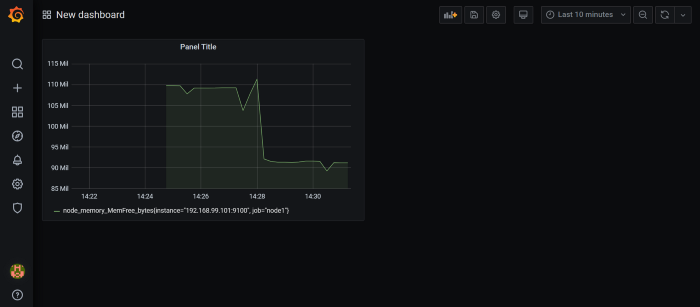
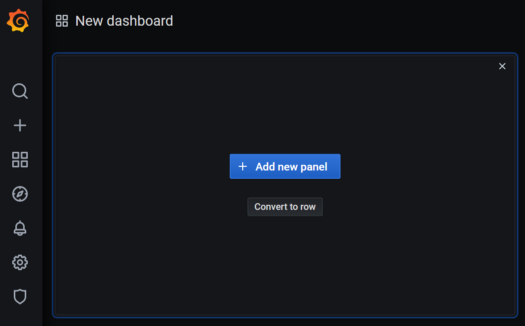
Now we have to create a dashboard. Head over to the respective section and select “Add a new panel
In the metrics, field enter the query, make any other changes you want and then select apply
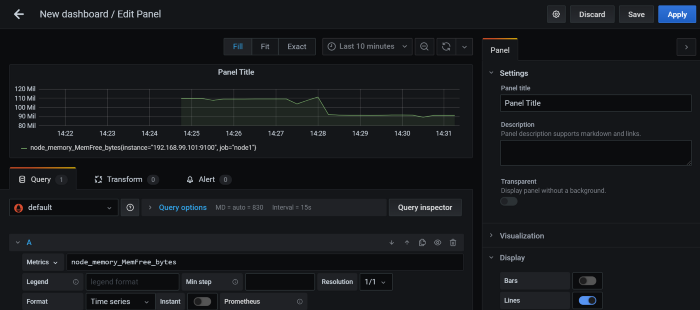
In the last, we can see the graphical representation of the metrics in real-time.